Help
Table of Contents
About Planner Arena
Planner Arena is a site for benchmarking sampling-based planners. The site is set up to show the performance of implementations of various sampling-based planning algorithms in the Open Motion Planning Library (OMPL). We have chosen a few benchmark problems that highlight some interesting aspects of motion planning.
Planner Arena is also a site you can use to analyze your own motion planning benchmark data. The easiest way to do so is to use the Benchmark class in your own code. See the relevant documentation on the OMPL site. The log files that are produced by the OMPL benchmarking facilities get turned into a SQLite database using a script. The database schema is described on this page as well. This means that you could produce benchmark databases with some other software for entirely different planning algorithms (or different implementations of algorithms in OMPL) and use Planner Arena to visualize the data. Much of the Planner Arena user interface is dynamically constructed based on the contents of the benchmark database. In particular, if you store different types of performance measures in your tables, Planner Arena will still be able to plot the results.
How to cite Planner Arena
If you use Planner Arena or the OMPL benchmarking facilities, then we kindly ask you to include the following citation in your publications:
BibTeX
@article{moll2015benchmarking-motion-planning-algorithms,
    Author = {Mark Moll and Ioan A. {\c{S}}ucan and Lydia E. Kavraki},
    Doi = {10.1109/MRA.2015.2448276},
    Journal = {{IEEE} Robotics \& Automation Magazine},
    Month = {September},
    Number = {3},
    Pages = {96--102},
    Title = {Benchmarking Motion Planning Algorithms: An Extensible Infrastructure for Analysis and Visualization},
    Volume = {22},
    Year = {2015}
}
Sample benchmark descriptions
The Planner Arena site contains some sample results produced with demo programs included in OMPL:
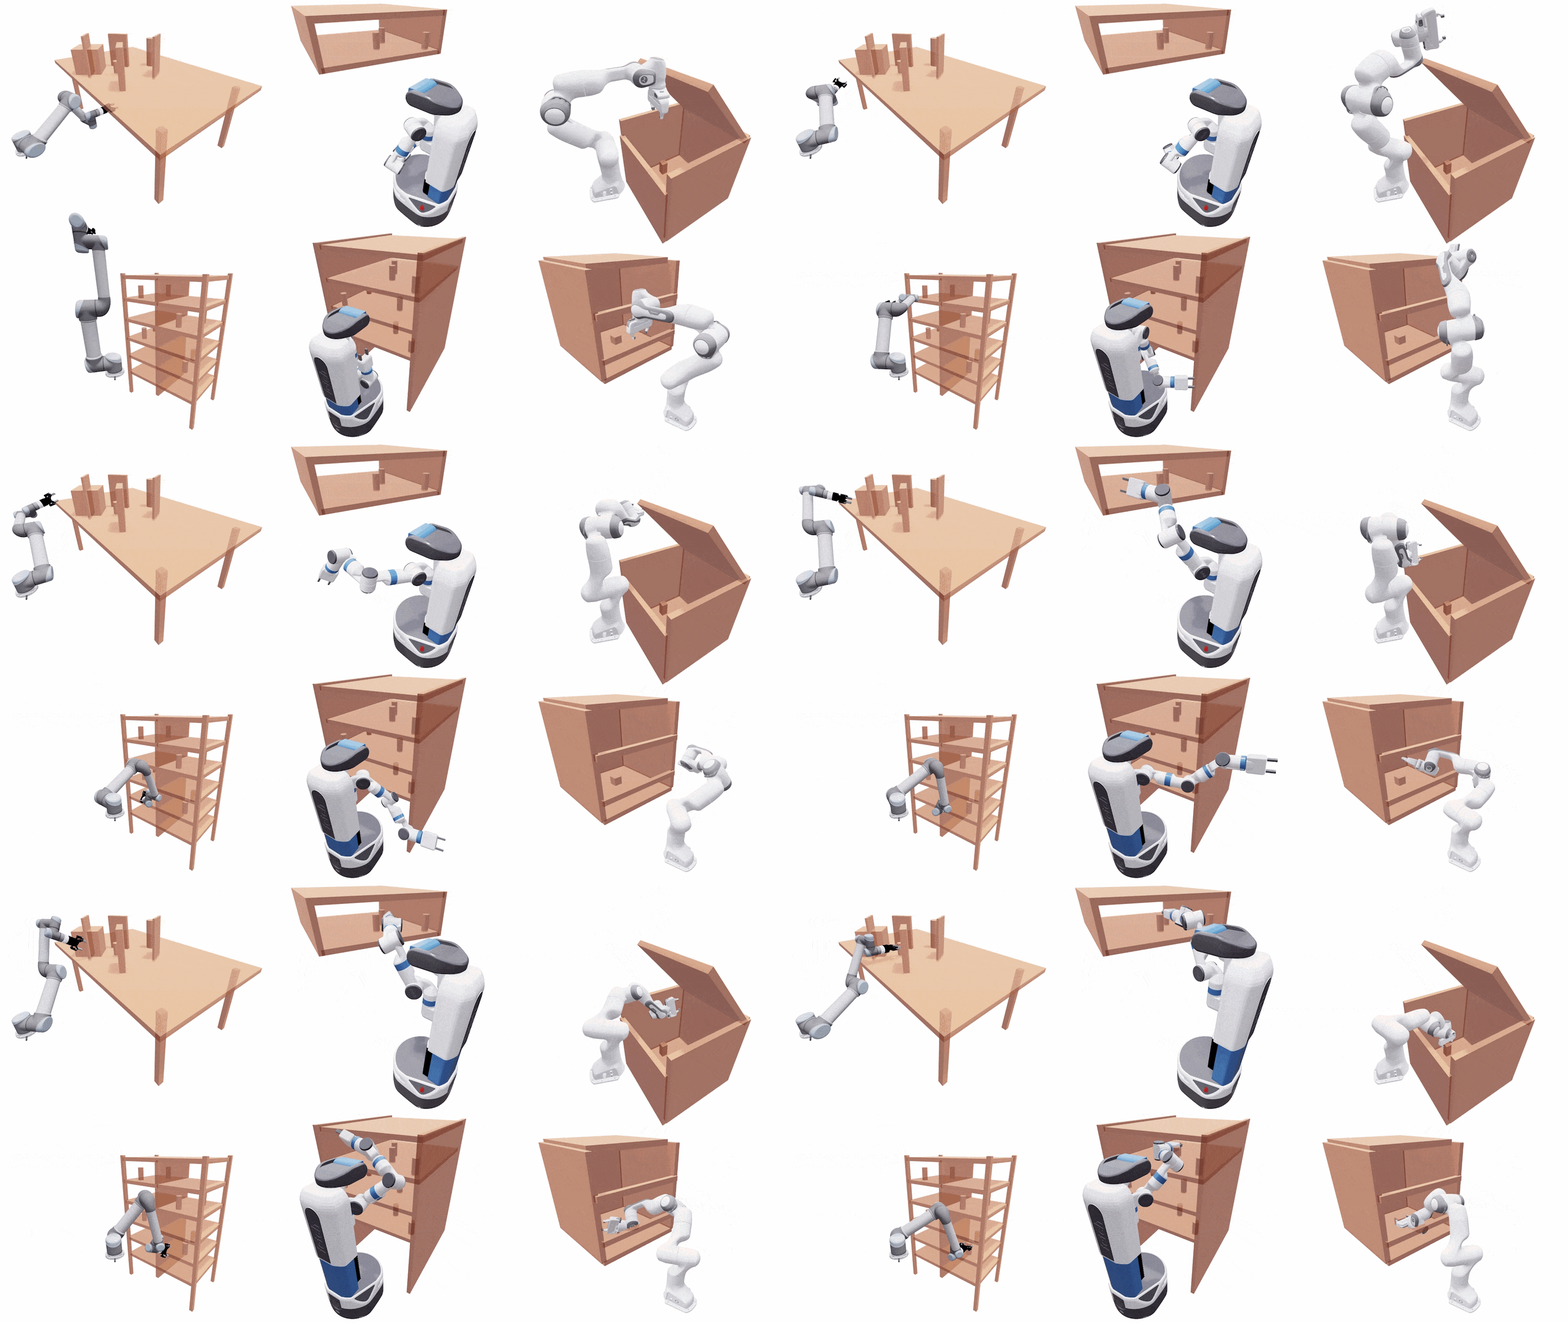
- motion_benchmarker_demo.py: We ran this demo multiple times on a variety of motion planning problems with different robots and different environment representations (meshes and pointclouds). This demo showcases the ability to perform motion planning on realistic robots. It uses the Python bindings and the integration with VAMP. Use the dropdown boxes to inspect results for a specific environment, representation, or robot.
- Koules: This demo showscases the kinodynamic planning capabilities of planners in OMPL. See the problem description and movie in the OMPL gallery under the section "Planning for Underactuated Systems in the Presence of Drift."
Plots of overall performance
The overall performance plots can show how different planners compare on various measures. The most common performance measure is the time it took a planner to find a feasible solution. For very hard problems where most planners time out without finding a solution, it might be informative to look at solution difference: the gap between the best found solution and the goal. Explanations of the various benchmark data collected by OMPL can be found here.
The overall performance page allows you to select a motion planning problem that was benchmarked, a particular benchmark attribute to plot, the OMPL version (in case the database contains data for multiple versions), and the planners to compare.
Most of the measures are plotted as box plots. Missing data is ignored. This is very important to keep in mind: if a planner failed to solve a problem 99 times out of 100 runs, then the average solution length is determined by one run! To make missing data more apparent, a table below the plot shows how many data points there were for each planner and how many of those were missing values (i.e., NULL, None, NA, etc.).
If your benchmark database contains results for parametrized benchmarks, then you can select results for different parameter values. By default, results are aggregated over all parameter values. You can also choose to show performance for selected planners across all parameter values by selecting “all (separate)” from the corresponding parameter selection widget.
The plots can be downloaded in two formats:
- PDF. This is useful if the plot is more or less “camera-ready” and might just need some touch ups with, e.g., Adobe Illustrator.
- Python pickle This contains the plot as well as all the data shown in the plot in a file format that can be loaded into Python with the
pickle.load command. The plot can be completely customized, further analysis can be applied to the data, or the data can be plotted in an entirely different way.
Progress of planners over time
Some planners in OMPL can not only report information after a run is completed, but also periodically report information during a run. In particular, for asymptotically optimal planners it is interesting to look at the convergence rate of the best path cost. Typically, the path cost is simply path length, but OMPL allows you to specify different optimization objectives.
By default, Planner Arena will plot the smoothed mean as well as a 95% confidence interval for the mean. Analogous to the performance plots, missing data is ignored. During the first couple seconds of a run, a planner may never find a solution path. Below the progress plot, we therefore plot the number of data points available for a particular planner at a particular 1-second time interval.
Comparison of different versions of the same planners
Regression plots show how the performance of the same planners change over different versions of OMPL. This is mostly a tool for the OMPL developers that can help in the identification of changes with unintended side effects on performance. However, it also allows a user to easily compare the performance of a user's modifications to the planners in OMPL to the latest official release.
In regression plots, the results are shown as a bar plot with error bars.
Information about the benchmark database
On the “Database info” page there are two tabs. Both show information for the motion planning problem selected under “Overall performance.” The first tab show how the benchmark was set up and on what kind of machine the benchmark was run. The second tab shows more detailed information on how the planners were configured. Almost any planner in OMPL has some parameters and this tab will show exactly the parameter values for each planner.
Changing the benchmark database
Finally, it is possible to upload your own database of benchmark data. We have limited the maximum database size to 30MB. If your database is larger, you can run Planner Arena locally. The “Change database” page allows you to switch back to the default database after you have uploaded your own database. You can also download the default database. This might be useful if you want to extend the database with your own benchmarking results and compare our default benchmark data with your own results.
Running Planner Arena locally
Docker
If you are familiar with Docker, then the easiest way to run Planner Arena locally is to run the same docker container we use for our web server:
docker pull kavrakilab/plannerarena:latest
docker run --rm -p 80:80 plannerarena:latest
Direct your browser to http://0.0.0.0:80 to see Planner Arena. There are a couple environment variables to configure Planner Arena by running docker run -e VARIABLE=VALUE ...:
-
DATABASE: The file name of the default benchmark database (inside the docker container). By mounting a host file inside the container, you can make a local benchmark database the default. For example:
docker run --rm -p 80:80 --mount type=bind,source=${HOME}/mybenchmark.db,target=/tmp/benchmark.db,readonly -e DATABASE=/tmp/benchmark.db plannerarena:latest
-
MAX_DB_SIZE (default value: 50000000): The maximum size in bytes of the database that can be uploaded to the server.
If you have cloned this repository and would like to make a custom docker image, type the following commands in the top-level directory of this repository:
docker build -t plannerarena:latest .
Advanced: Creating your own benchmark databases outside of OMPL
In some cases you may want to generate Planner Arena databases with your own code. The MoveIt project, for example, uses OMPL, but replicates much of the benchmarking infrastructure to produce its own benchmark log files that can be turned into Planner Arena benchmark databases. In your own code, you have the choice to produce log files that can be read by ompl_benchmark_statistics.py to produce a benchmark database or write code to produce a database directly. Below, we will describe the log file format that can be parsed by ompl_benchmark_statistics.py and the database format. Understanding the database format is also helpful if you are interested in making your own custom visualizations (with or without Planner Arena).
The benchmark log file format
The benchmark log files have a pretty simple structure. Below we have included their syntax in Extended Backus–Naur Form. This may be useful for someone interested in extending other planning libraries with similar logging capabilities (which would be helpful in a direct comparison of the performance of planning libraries).
logfile               ::= preamble planners_data;
preamble              ::= [version] experiment [exp_property_count exp_properties] hostname date setup [cpuinfo]
                          random_seed time_limit memory_limit [num_runs]
                          total_time [num_enums enums] num_planners;
version               ::= library_name " version " version_number EOL;
experiment            ::= "Experiment " experiment_name EOL;
exp_property_count    ::= int " experiment properties" EOL;
exp_properties        ::= exp_property | exp_property exp_properties;
exp_property          ::= name property_type "=" num EOL;
hostname              ::= "Running on " host EOL;
date                  ::= "Starting at " date_string EOL;
setup                 ::= multi_line_string;
cpuinfo               ::= multi_line_string;
multi_line_string     ::= "<<<|" EOL strings "|>>>" EOL;
strings               ::= string EOL | string EOL strings
random_seed           ::= int " is the random seed" EOL;
time_limit            ::= float " seconds per run" EOL;
memory_limit          ::= float " MB per run" EOL;
num_runs              ::= int " runs per planner" EOL;
total_time            ::= float " seconds spent to collect the data" EOL;
num_enums             ::= num " enum type" EOL;
enums                 ::= enum | enum enums;
enum                  ::= enum_name "|" enum_values EOL;
enum_values           ::= enum_value | enum_value "|" enum_values;
num_planners          ::= int " planners" EOL;
planners_data         ::= planner_data | planner_data planners_data;
planner_data          ::= planner_name EOL int " common properties" EOL
                          planner_properties int " properties for each run" EOL
                          run_properties int " runs" EOL run_measurements
                          [int "progress properties for each run" EOL
                          progress_properties int " runs" EOL
                          progress_measurements] "." EOL;
planner_properties    ::= "" | planner_property planner_properties;
planner_property      ::= property_name " = " property_value EOL;
run_properties        ::= property | property run_properties;
progress_properties   ::= property | property progress_properties;
property              ::= property_name " " property_type EOL;
property_type         ::= "BOOLEAN" | "INTEGER" | "REAL";
run_measurements      ::= run_measurement | run_measurement run_measurements;
run_measurement       ::= data "; " | data "; " run_measurement;
data                  ::= num | "inf" | "nan" | "";
progress_measurements ::= progress_measurement EOL
                         | progress_measurement EOL progress_measurements;
progress_measurement  ::= prog_run_data | prog_run_data ";" progress_measurement;
prog_run_data         ::= data "," | data "," prog_run_data;
Here, EOL denotes a newline character, int denotes an integer, float denotes a floating point number, num denotes an integer or float value and undefined symbols correspond to strings without whitespace characters. The exception is property_name which is a string that can have whitespace characters. It is also assumed that if the log file says there is data for k planners, then that really is the case (likewise for the number of run measurements and the optional progress measurements).
The benchmark database schema
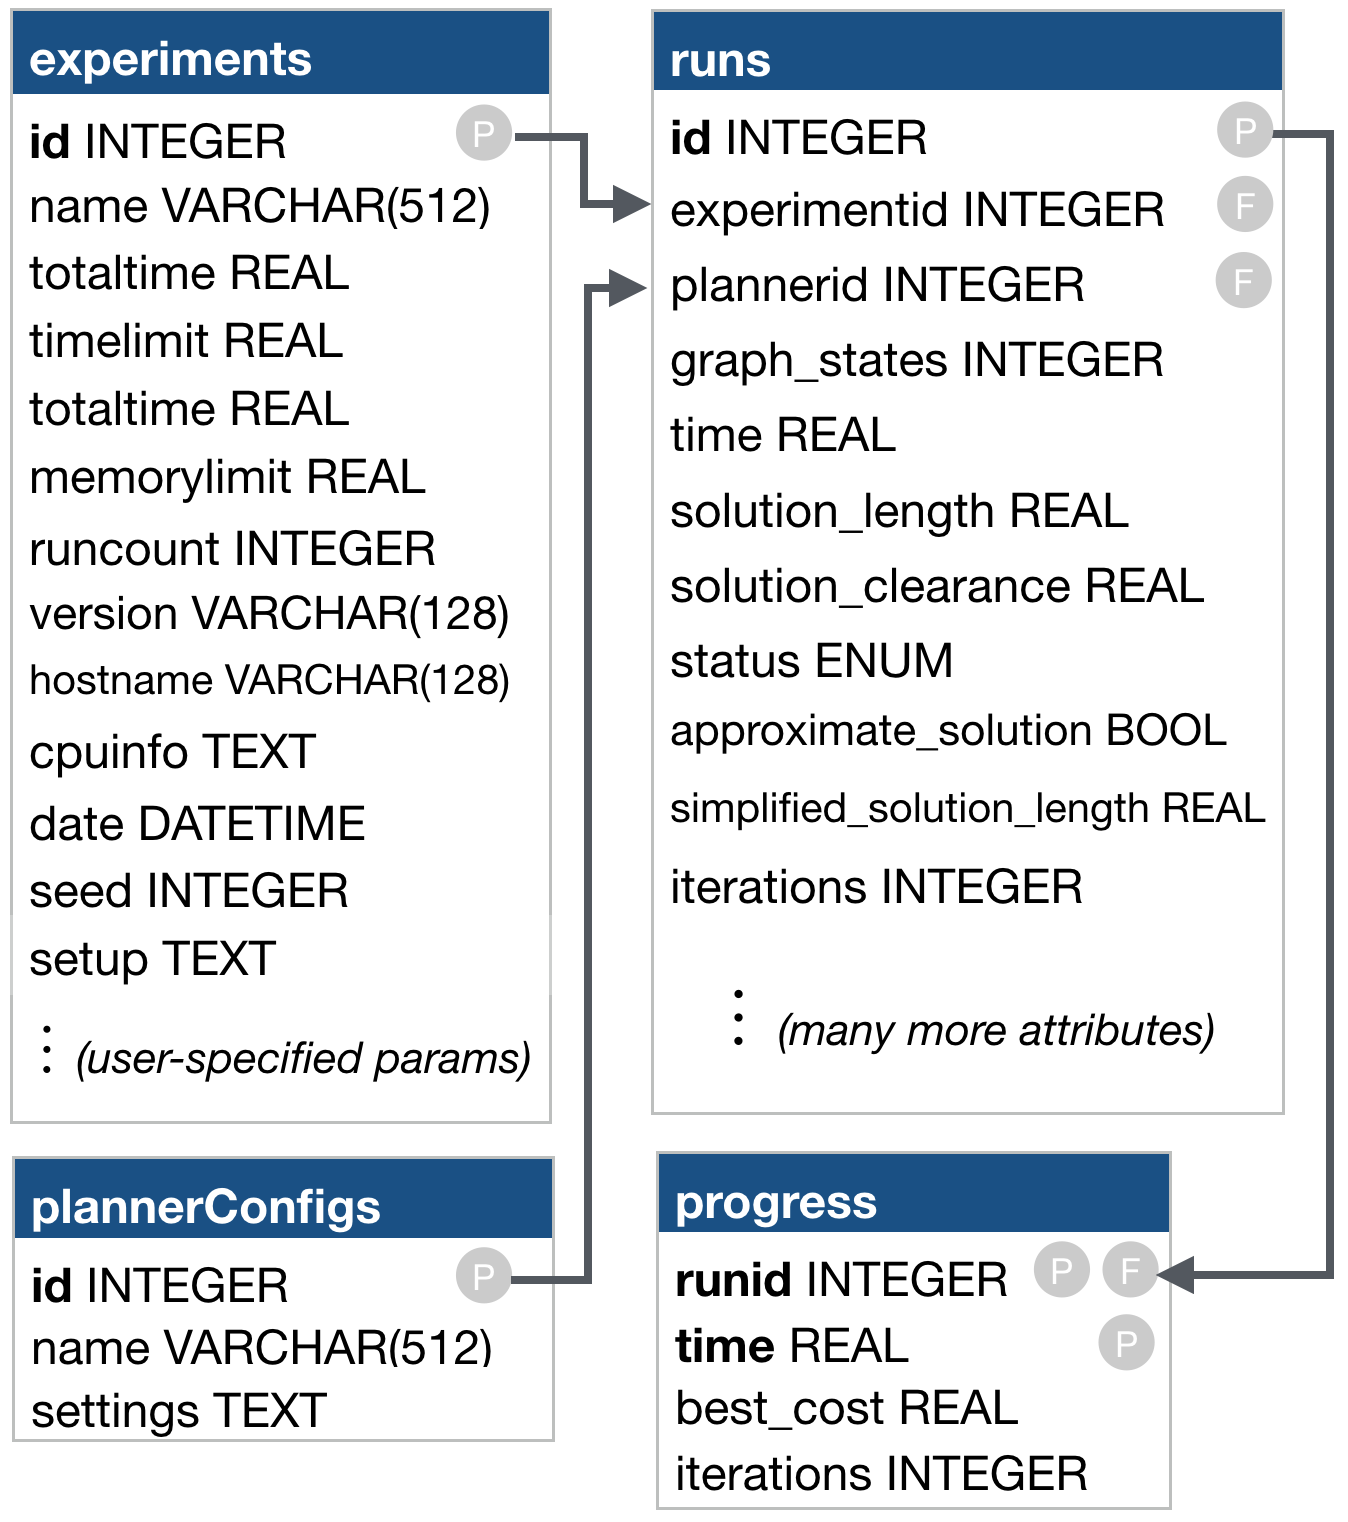 The benchmark database schema
The ompl_benchmark_statistics.py script can produce a series of plots from a database of benchmark results, but in many cases you may want to produce your own custom plots. For this it useful to understand the schema used for the database. There are five tables in a benchmark database:
-
experiments. This table contains the following information:
- id: an ID used in the
runs table to denote that a run was part of a given experiment.
- name: name of the experiment.
- totaltime: total duration of the experiment in seconds.
- timelimit: time limit for each individual run in seconds.
- memorylimit: memory limit for each individual run in MB.
- runcount: the number of times each planner configuration was run.
- version: the version of OMPL that was used.
- hostname: the host name of the machine on which the experiment was performed.
- cpuinfo: CPU information about the machine on which the experiment was performed.
- date: the date on which the experiment was performed.
- seed: the random seed used.
- setup: a string containing a “print-out” of all the settings of the SimpleSetup object used during benchmarking.
Any additional columns are assumed to be numeric values corresponding to experimental hyperparameters. This can be useful to show planner performance as a function of, e.g., number of revolute joints for a parametric robot arm or number of obstacles in parametric environment. Planner Arena will show a selection widget for each hyperparameter. The user can choose to (1) aggregate planner runs over all hyperparameter values, (2) show performance separated out by hyperparameter value, or (3) show performance for one selected hyperparameter value.
-
plannerConfigs. There are a number of planner types (such as PRM and RRT), but each planner can typically be configured with a number of parameters. A planner configuration refers to a planner type with specific parameter settings. The plannerConfigs table contains the following information:
- id: an ID used in the
runs table to denote that a given planner configuration was used for a run.
- name: the name of the configuration. This can be just the planner name, but when using different parameter settings of the same planner it is essential to use more specific names.
- settings: a string containing a “print-out” of all the settings of the planner.
-
enums: This table contains description of enumerate types that are measured during benchmarking. By default there is only one such such type defined: ompl::base::PlannerStatus. The table contains the following information:
- name: name of the enumerate type (e.g., “status”).
- value: numerical value used in the runs
- description: text description of each value (e.g. “Exact solution,” “Approximate solution,” “Timeout,” etc.)
-
runs. The runs table contains information for every run in every experiment. Each run is identified by the following fields:
- id: ID of the run
- experimentid: ID of the experiment to which this run belonged.
- plannerid: ID of the planner configuration used for this run.
In addition, there will be many benchmark statistics. None are required, but the OMPL planners all report the properties described above such as time, memory, solution length, simplification time, etc. It is possible that not all planners report the same properties. In that case, planners that do not report such properties will have NULL values in the corresponding fields. Users can programmatically define new properties that can get logged for each run in OMPL.
-
progress. Some planners (such as RRT*) can also periodically report properties during a run. This can be useful to analyze the convergence or growth rate. The progress table contains the following information:
- runid: the ID of the run for which progress data was tracked.
- time: the time (in sec.) at which the property was measured.
.
The actual properties stored depend on the planner, but in the case of RRT* it stores the following additional fields:
- iterations: the number of iterations.
- collision_checks: the number of collision checks (or, more precisely, the number state validator calls).
- best_cost: the cost of the best solution found so far.
As with run properties, users can programmatically define their own progress properties that will be logged during each run of a planner.